Intelledox Visual Insights
Infiniti has many features around Analytics, capturing how users interact with forms and making this data available easily from Infiniti Data Source Type.
As a complement, a new Question type was developed allowing solution designers to add Interactive graphs within Intelledox Infiniti forms and Dashboards. This Question Type is named as Visuals, and is based on Vega (visualization grammar), which provides a declarative language for creating an interactive visualization in a JSON format.
Analytics Module
Please contact your account manager if you are interested in the Analytics Module. Please mention you want to deploy the Question Type Visuals as a separate .dll file has to be provided.
Installation
Before installing this Question Type, you must consider the following requirements:
You must have administrator/elevated permissions to the Infiniti web server, including the ability to copy and replace files in the Infiniti installation folder. This is usually c:\inetpub\wwwroot\infiniti however may vary from system to system.
You must have the following installation file:
IXVisuals.dll
Important
Changes to the configuration may cause interruptions to users in forms. Before installing this Extension in a production Infiniti environment, ensure the environment is backed up. It is recommended that this installation is tested in a non-production environment first, and installed during scheduled downtime.
Note that [Infiniti Produce Path] refers to the installation path on the web server running Infiniti, where the Produce site has been installed. By default, this is c:\inetpub\wwwroot\infiniti\produce however may vary from environment to environment. Equally, [Infiniti Manage Path] refers to where the Manage site has been installed.
- Copy
IXVisuals.dllinto the following folder on the Infiniti web server:[Infiniti Produce Path]\bin - Using a text editor such as Notepad, open the file
[Infiniti Produce Path]\appsettings.jsonand add the following line withinExtensions.
{
  "Extensions": [
  ...
  "IXVisuals.AdvancedVisuals, IXVisuals",
  "IXVisuals.AdvancedVisualsDataSource, IXVisuals"
  ],
  ...
}
- Similarly, for Manage, copy
IXVisuals.dllinto the following folder on the Infiniti web server:[Infiniti Manage Path]\bin - Using a text editor such as Notepad, open the file
[Infiniti Manage Path]\appsettings.jsonand add the following line withinExtensions.
{
  "Extensions": [
  ...
  "IXVisuals.AdvancedVisualsDataSource, IXVisuals"
  ],
  ...
}
Note
Ensure you have elevated privileges when opening the appsettings.json file, otherwise, you may not be able to save in the current folder.
- Save changes applied to
appsettings.json. - Modify .skin file of current Custom Theme. Normally located"
[Infiniti Produce Path]\App_Themes\customThemeadding following lines withinWizardHeaderLogoSkintag.
<asp:label runat="server" SkinId="WizardHeaderLogoSkin">
<!--  VEGA VISUALIZATION  -->
<script src="https://vega.github.io/vega/assets/promise.min.js"></script>
    <script src="https://vega.github.io/vega/assets/symbol.min.js"></script>
    <script src="https://vega.github.io/vega/assets/fetch.min.js"></script>
    <script src="https://d3js.org/d3.v3.min.js"></script>
    <script src="https://cdnjs.cloudflare.com/ajax/libs/vega/3.3.1/vega.js"></script>
    <script src="https://cdnjs.cloudflare.com/ajax/libs/vega-lite/2.6.0/vega-lite.js"></script>
    <script>
        if (!String.prototype.startsWith) {
            String.prototype.startsWith = function (search, pos) {
                return this.substr(!pos || pos < 0 ? 0 : +pos, search.length) === search;
            };
        }
    </script>
<script src="https://cdnjs.cloudflare.com/ajax/libs/vega-embed/3.13.1/vega-embed.js"></script>
</asp:label>
- Register Custom Theme in Produce
appsettings.json. (More information in Custom Themes)
"AppSettings": {
    "Theme": "customTheme"
  }
Note
App Pool might need to be restarted to include changes.
- Navigate to Produce and Manage in your browser, an absence of error messages suggests the Question Type has installed correctly.
- Create a new Project in Design. The following icon should be available in the top toolbox.

Visuals
Adding a Bar Chart Graph
This is probably the most basic but also powerful graph available, let's get started.
Stage I Content Library
- Create a new JSON file in your local and name it
barChart.jsonusing following code:
{
  "$schema": "https://vega.github.io/schema/vega-lite/v2.json",
  "data": {
    "values": ##data##
  },
  "mark": "bar",
  "encoding": {
    "x": {"field": "category", "type": "ordinal"},
    "y": {"field": "amount", "type": "quantitative"}
  }
}
Note
##data##is not a valid JSON syntax; this is a keyword used by Visuals Question Type that will be replaced with a JSON formatted structure mapping category and amount values.
- Create a new folder named
Visualswithin Intelledox Infiniti Content Library. - Select
Visualsfolder. - Click "New Content Item".
- Click "Attachment".
- Upload the newly created
barChart.jsonfile and name it barChart. - Click "Save"
Stage II Creating Infiniti Data Source
- Create a new Data Source in Manage.
| Data Source Name | Infiniti |
| Connection Type | Infiniti |
- Create a new Data Object Type:
"Analytics Device Log". Choose a relevant Display Name like "v10 Analytics Device Log", add all available Filter and Display Fields and click "Save".
Stage III Create Project
- Create a new Intelledox Infiniti Project (Dashboard Type).
- Add the newly created Intelledox Infiniti Data Source "v10 Analytics Device Log".
| Property | Value |
|---|---|
| Question Text | Infiniti - v10 Analytics Device Log |
| Data Source | Infiniti |
| Table/View | v10 Analytics Device Log |
| Visible | Unchecked |
| Selection | Multiple Rows |
| Unique Field | (None) |
| Default Type | (None) |
- Add the following answers to the Data Source:
| Answer Name | Data Field | Formula |
|---|---|---|
| LoginTimeUtc | LoginTimeUtc | |
| LoginTimeUtcFormula | [Formula] | =format([q1.LoginTimeUtc], "MM/dd/yyyy hh:mm") Reference to the LoginTimeUtc Data Source Answer. In this case eg: [q1.LoginTimeUtc] |
| Browser | Browser |
- Simply drag and drop Visuals Question Type and provide following inputs:
| Input Name | Description | Value |
|---|---|---|
| Visual Definition | References Content Library Item that contains JSON definition | barChart |
| Data | Allows adding variables and values (pipe separated values, making it easier for data coming from a repeating section or a data source) that then will be mapped accordingly into the visualization definition, replacing the keyword ##data##. | category=A|B|C|D|E|F|G|H amount=28|55|43|91|81|53|19|87 |
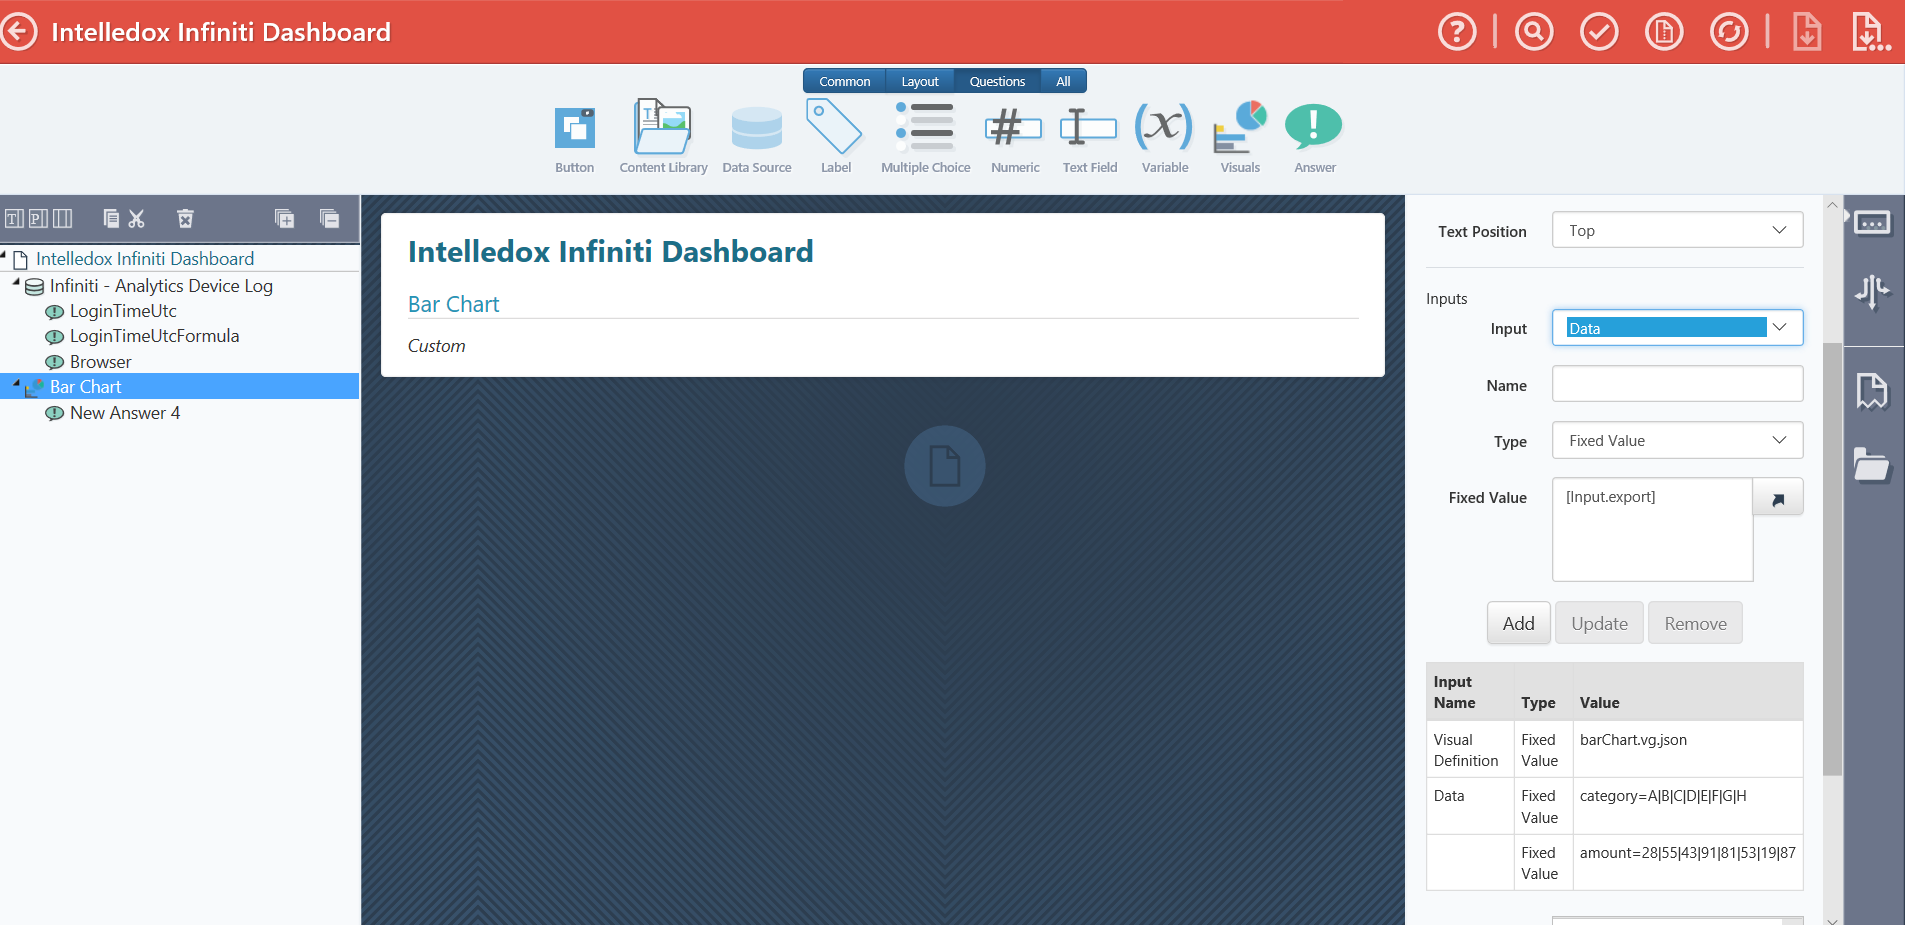
Intelledox Infiniti Produce
Usage in a Map
In the previous example, we learned how to create a simple Bar Chart manually passing in the data. For this example, we will reference an Intelledox Infiniti Data Source.
Good Practice
It is recommended to create these visualisations as Project Fragments so they can be easily included in different projects across different Intelledox Infiniti Instances.
- To begin with, add following JSON definition into Content Library as an attachment and name it "worldMap", (same process described in previous tutorial "Adding a Bar Chart Graph")
{
  "$schema": "https://vega.github.io/schema/vega/v3.0.json",
  "width": 900,
  "height": 500,
  "autosize": "none",
  "signals": [
    {
      "name": "tx",
      "update": "width / 2"
    },
    {
      "name": "ty",
      "update": "300"
    },
    {
      "name": "scale",
      "value": 140
    },
    {
      "name": "angles",
      "value": [ 0, 0 ]
    },
    {
      "name": "cloned",
      "value": null
    },
    {
      "name": "start",
      "value": null
    },
    {
      "name": "drag",
      "value": null
    },
    {
      "name": "delta",
      "value": null
    },
    {
      "name": "rotateX",
      "value": 0
    },
    {
      "name": "centerY",
      "value": 0
    }
  ],

  "projections": [
    {
      "name": "projection",
      "type": "mercator",
      "scale": { "signal": "scale" },
      "rotate": [
        { "signal": "rotateX" },
        0,
        0
      ],
      "center": [
        0,
        { "signal": "centerY" }
      ],
      "translate": [
        { "signal": "tx" },
        { "signal": "ty" }
      ]
    }
  ],

  "data": [
    {
      "name": "world",
      "url": "https://vega.github.io/vega/data/world-110m.json",
      "format": {
        "type": "topojson",
        "feature": "countries"
      }
    },
    {
      "name": "graticule",
      "transform": [
        {
          "type": "graticule",
          "step": [ 15, 15 ]
        }
      ]
    },
    {
      "name": "infiniti",
      "values": ##data##,
      "format": {
        "type": "json",
        "parse": "auto"
      },
      "transform": [
        {
          "type": "geopoint",
          "projection": "projection",
          "fields": [ "longitude", "latitude" ]
        },
        {
          "type": "filter",
          "expr": "datum.x != null && datum.y != null"
        }
      ]
    }
  ],

  "marks": [
    {
      "type": "shape",
      "from": { "data": "graticule" },
      "encode": {
        "enter": {
          "strokeWidth": { "value": 1 },
          "stroke": { "value": "#ddd" },
          "fill": { "value": null }
        }
      },
      "transform": [
        {
          "type": "geoshape",
          "projection": "projection"
        }
      ]
    },
    {
      "type": "shape",
      "from": { "data": "world" },
      "encode": {
        "enter": {
          "strokeWidth": { "value": 0.5 },
          "stroke": { "value": "#000000" },
          "fill": { "value": "#f3fff2" }
        }
      },
      "transform": [
        {
          "type": "geoshape",
          "projection": "projection"
        }
      ]
    },
    {
      "type": "symbol",
      "from": { "data": "infiniti" },
      "encode": {
        "enter": {
          "size": { "value": 30 },
          "fill": { "value": "red" },
          "fillOpacity": { "value": 1 },
          "stroke": { "value": "orange" },
          "strokeWidth": { "value": 0.5 }
        },
        "update": {
          "x": { "field": "x" },
          "y": { "field": "y" }
        }
      }
    }
  ]
}
-
Create a new Intelledox Infiniti Data Source in Manage (no need to perform this step if you already have one).
-
Create a new Data Object Type:
"Analytics Device Log". Choose a relevant Display Name like "v10 Analytics Device Log", add all available Filter and Display Fields and click "Save".
-
Open Design and create a "New Project".
-
Add the newly created Intelledox Infiniti Data Source "v10 Analytics Device Log".
| Property | Value |
|---|---|
| Question Text | Infiniti - v10 Analytics Device Log |
| Data Source | Infiniti |
| Table/View | v10 Analytics Device Log |
| Visible | Unchecked |
| Selection | Multiple Rows |
| Unique Field | (None) |
| Default Type | (None) |
- Add the following answers to the datasource:
| Answer Name | Data field |
|---|---|
| latitude | Latitude |
| longitude | Longitude |
- Add a new Visuals Question below the Data Source with following parameters:
| Property | Value |
|---|---|
| Question Text | Map |
| Text Position | Top |
| Mandatory | Unchecked |
| Input (Data) | Name=longitude Fixed Value=Reference to longitude Data Source Answer. In this case [q1.Longitude] |
| Input (Data) | Name=latitude Value=Reference to latitude Data Source Answer. In this case [q1.Latitude] |
| Input (Visual Definition) | Type=Fixed Value Fixed value= Type the Content libary file name. In this case WorldMap.vg.json |
- Save Project and view in Produce.
Include Visual Insights Image in Infiniti Template
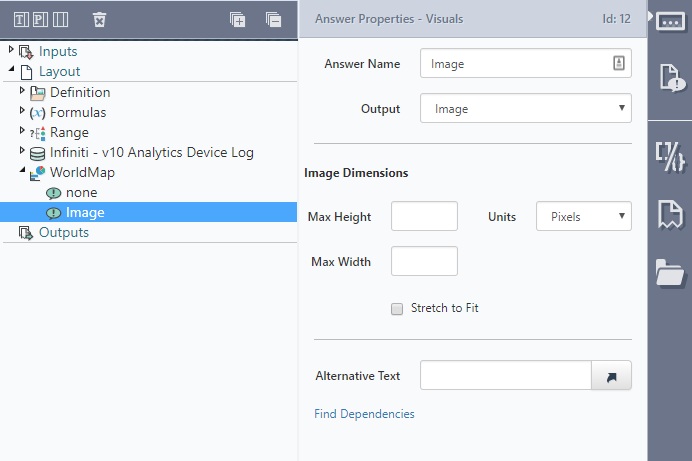
- Add another new Answer to the Visuals Question and call it "Image". From the Output drop-down list, choose
Image.
-
You can also control the Image dimensions in the output document by specifying the maximum height/width of the Image.
-
Drag and drop your placeholder to link it to the Image answer.
More examples
Here a set of examples utilising Intelledox Visual Insights for data visualization.
Stacked Bar Chart (Browser Usage)
In this example, we will be pulling data from Intelledox Infiniti Analytics Data Sources to visualize Browser Usage.
-
Create a new Intelledox Infiniti Data Source in Manage (no need to perform this step if you already have one).
-
Add following JSON definition into Content Library and name it "stackedBarChart", (the same process described in the previous tutorial "Adding a Bar Chart Graph").
{
  "$schema": "https://vega.github.io/schema/vega-lite/v2.json",
  "title":"Browser Usage",
  "data": {
    "values": ##data##
  },
  "mark": "bar",
  "encoding": {
    "x": {
      "timeUnit": "month",
      "field": "timeUTC",
      "type": "ordinal",
      "axis": {"title": "Month of the year"}
    },
    "y": {
      "aggregate": "count",
      "type": "quantitative"
    },
    "color": {
      "field": "browser",
      "type": "nominal",
      "legend": {"title": "Browser"}
    }
  }
}
- (Skip this step if you already have a Data Object for Analytics Device Log) Create a new Data Object Type:
"Analytics Device Log". Choose a relevant Display Name like "v10 Analytics Device Log", add all available Filter and Display Fields and click "Save". - Open Design and "Crete a New Project". Name it: "pf_Visual_Browser" with Project Type: "Fragment Portion".
- Add the Intelledox Infiniti Data Source "v10 Analytics Device Log", and add Browser and LoginTimeUTC answers.
Date Format
Vega expects dates to come in Month/Day/Year format; it is required to transform original data source answer. To do this, create an extra Data Source Answer with Data Field [Formula] and add this into Fomula:
=format([q1.LoginTimeUtc], "MM/dd/yyyy hh:mm").
| Property | Value |
|---|---|
| Question Text | Infiniti - v10 Analytics Device Log |
| Data Source | Infiniti |
| Visible | Unchecked |
| Selection | Multiple Rows |
| Unique Field | (None) |
| Default Type | (None) |
- Add a new Visuals Question below the Data Source with following parameters:
| Property | Value |
|---|---|
| Question Text | Stacked Bar Chart |
| Text Position | Top |
| Mandatory | Unchecked |
| Input (Data) | Name=browser Value=Reference to browser Data Source Answer ([q1.Browser]). Name=timeUTC Value=Reference to browser Data Source Answer ([q1.timeUTC]). |
| Visual Definition | stackedBarChart |
- Save Project and add it to a current Intelledox Infiniti Form or Dashboard.
Example output
Sunburst Chart (Page Journey)
In this example, we will be pulling data from Intelledox Intelledox Visual Insights Data Sources to visualize Page Journey.
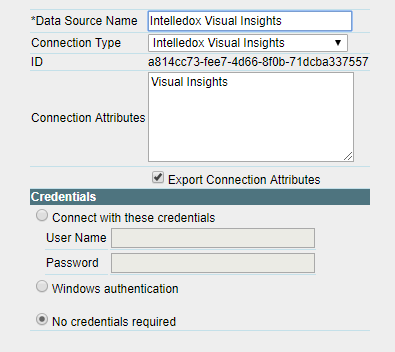
- Create a new Intelledox Visual Insights Data Source in Manage (no need to perform this step if you already have one). The connection string in this case could be any text.
- Add these following JSON definitions into Content Library and name it "Sunburst" and "Radial" respectively, (the same process described in the previous tutorial "Adding a Bar Chart Graph").
{
  "$schema": "https://vega.github.io/schema/vega/v3.0.json",
  "width": 600,
  "height": 600,
  "padding": 5,
  "autosize": "none",
  "data": [
    {
      "name": "tree",
      "values" : ##data##,
      "transform": [
        {
          "type": "stratify",
          "key": "id",
          "parentKey": "parent"
        },
        {
          "type": "partition",
          "field": "occurances",
          "size": [{"signal": "2 * PI"}, {"signal": "width / 2"}],
          "as": ["a0", "r0", "a1", "r1", "depth", "children"]
        }
      ]
    }
  ],
  "scales": [
    {
      "name": "color",
      "type": "ordinal",
      "range": {"scheme": "tableau20"}
    }
  ],
  "marks": [
    {
      "type": "arc",
      "from": {"data": "tree"},
      "encode": {
        "enter": {
          "x": {"signal": "width / 2"},
          "y": {"signal": "height / 2"},
          "fill": {"scale": "color", "field": "depth"},
          "tooltip": {"signal": "datum.pageTitle + (datum.occurances ? ' (' + datum.occurances + ' users)' : '')"}
        },
        "update": {
          "startAngle": {"field": "a0"},
          "endAngle": {"field": "a1"},
          "innerRadius": {"field": "r0"},
          "outerRadius": {"field": "r1"},
          "stroke": {"value": "white"},
          "strokeWidth": {"value": 0.5},
          "zindex": {"value": 0}
        },
        "hover": {
          "stroke": {"value": "red"},
          "strokeWidth": {"value": 2},
          "zindex": {"value": 1}
        }
      }
    }
  ]
}
{
  "$schema": "https://vega.github.io/schema/vega/v3.0.json",
  "width": 720,
  "height": 720,
  "padding": 5,
  "autosize": "none",

  "signals": [
    {
      "name": "labels", "value": true,
      "bind": {"input": "checkbox"}
    },
    {
      "name": "radius", "value": 280,
      "bind": {"input": "range", "min": 20, "max": 600}
    },
    {
      "name": "extent", "value": 360,
      "bind": {"input": "range", "min": 0, "max": 360, "step": 1}
    },
    {
      "name": "rotate", "value": 0,
      "bind": {"input": "range", "min": 0, "max": 360, "step": 1}
    },
    {
      "name": "layout", "value": "tidy",
      "bind": {"input": "radio", "options": ["tidy", "cluster"]}
    },
    {
      "name": "links", "value": "line",
      "bind": {
        "input": "select",
        "options": ["line", "curve", "diagonal", "orthogonal"]
      }
    },
    { "name": "originX", "update": "width / 2" },
    { "name": "originY", "update": "height / 2" }
  ],
  "data": [
    {
      "name": "tree",
       "values": ##data##,
      "transform": [
        {
          "type": "stratify",
          "key": "id",
          "parentKey": "parent"
        },
        {
          "type": "tree",
          "method": {"signal": "layout"},
          "size": [1, {"signal": "radius"}],
          "as": ["alpha", "radius", "depth", "children"]
        },
        {
          "type": "formula",
          "expr": "(rotate + extent * datum.alpha + 270) % 360",
          "as":   "angle"
        },
        {
          "type": "formula",
          "expr": "PI * datum.angle / 180",
          "as":   "radians"
        },
        {
          "type": "formula",
          "expr": "inrange(datum.angle, [90, 270])",
          "as":   "leftside"
        },
        {
          "type": "formula",
          "expr": "originX + datum.radius * cos(datum.radians)",
          "as":   "x"
        },
        {
          "type": "formula",
          "expr": "originY + datum.radius * sin(datum.radians)",
          "as":   "y"
        }
      ]
    },
    {
      "name": "links",
      "source": "tree",
      "transform": [
        { "type": "treelinks", "key": "id" },
        {
          "type": "linkpath",
          "shape": {"signal": "links"}, "orient": "radial",
          "sourceX": "source.radians", "sourceY": "source.radius",
          "targetX": "target.radians", "targetY": "target.radius"
        }
      ]
    }
  ],

  "scales": [
    {
      "name": "color",
      "type": "sequential",
      "range": {"scheme": "magma"},
      "domain": {"data": "tree", "field": "depth"},
      "zero": true
    }
  ],

  "marks": [
    {
      "type": "path",
      "from": {"data": "links"},
      "encode": {
        "update": {
          "x": {"signal": "originX"},
          "y": {"signal": "originY"},
          "path": {"field": "path"},
          "stroke": {"value": "#ccc"}
        }
      }
    },
    {
      "type": "symbol",
      "from": {"data": "tree"},
      "encode": {
        "enter": {
          "size": {"value": 100},
          "stroke": {"value": "#fff"}
        },
        "update": {
          "x": {"field": "x"},
          "y": {"field": "y"},
          "fill": {"scale": "color", "field": "depth"}
        }
      }
    },
    {
      "type": "text",
      "from": {"data": "tree"},
      "encode": {
        "enter": {
          "text": {"field": "pageTitle"},
          "fontSize": {"value": 9},
          "baseline": {"value": "middle"}
        },
        "update": {
          "x": {"field": "x"},
          "y": {"field": "y"},
          "dx": {"signal": "(datum.leftside ? -1 : 1) * 6"},
          "angle": {"signal": "datum.leftside ? datum.angle - 180 : datum.angle"},
          "align": {"signal": "datum.leftside ? 'right' : 'left'"},
          "opacity": {"signal": "labels ? 1 : 0"}
        }
      }
    }
  ]
}
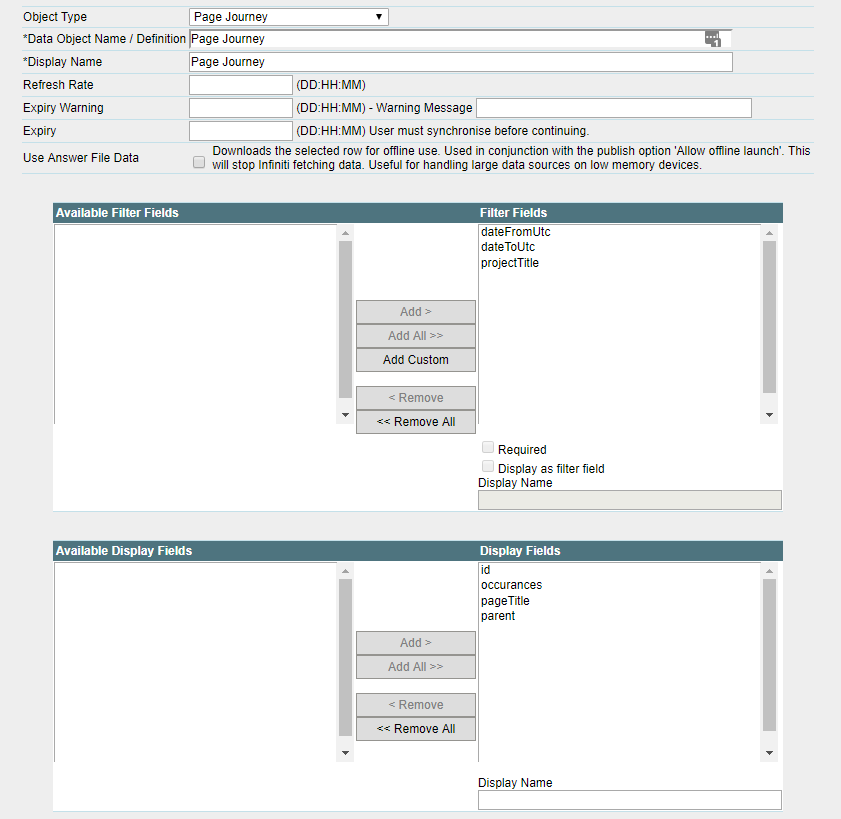
- Create a new Data Object Type:
"Page Journey". Choose a relevant Display Name like "Page Journey", add all available Filter and Display Fields and click "Save".
- Open Design and "Crete a New Project". Name it: "AnalyticsVisuals_Fragment_PageJourney" with Project Type: "Fragment Portion".
- Add the Intelledox Visual Insights Data Source, and add dateFromUtc, dateToUtc and projectTitle answers.
Note
All Infiniti published forms can be retrieved from Infiniti Data Source - Data Object Type
"System Projects"
Date Format
Vega expects dates to come in Year/Month/Day/ format; it is required to transform original data source answer. To do this, create an extra Data Source Answer with Data Field [Formula] and add this into Formula:
=format([q1.LoginTimeUtc], \"yyyy-MM-ddTHH:mm:ss\").
| Property | Value |
|---|---|
| Question Text | IXVisuals |
| Data Source | Intelledox Visual Insights |
| Visible | Unchecked |
| Selection | Multiple Rows |
| Unique Field | (None) |
| Default Type | (None) |
- Add a new Visuals Question below the Data Source with these following parameters:
| Input Name | Value |
|---|---|
| Question Text | Sunburst |
| Text Position | (None) |
| Mandatory | Unchecked |
| Input (Data) | Name=id Value=Reference to Intelledox Visual Insights Data Source Answer ([q1.id]). Name=parent Value=Reference to Intelledox Visual Insights Data Source Answer ([q1.parent]). Name=pageTitle Value=Reference to Intelledox Visual Insights Data Source Answer ([q1.pageTitle]). Name=occurances Value=Reference to Intelledox Visual Insights Data Source Answer ([q1.occurances]). |
| Visual Definition | sunburst.vg.json |
- Add another new Visuals Question below the Data Source with these following parameters:
| Input Name | Value |
|---|---|
| Question Text | Sunburst |
| Text Position | (None) |
| Mandatory | Unchecked |
| Input (Data) | Name=id Value=Reference to Intelledox Visual Insights Data Source Answer ([q1.id]). Name=parent Value=Reference to Intelledox Visual Insights Data Source Answer ([q1.parent]). Name=pageTitle Value=Reference to Intelledox Visual Insights Data Source Answer ([q1.pageTitle]). Name=occurances Value=Reference to Intelledox Visual Insights Data Source Answer ([q1.occurances]). |
| Visual Definition | radial.vg.json |
- Save Project and add it to a current Intelledox Infiniti Form or Dashboard.
Updated over 5 years ago


